ABSTRACT
TASK
The goal of our project is to find the best regression task to predict the total number of votes (upvotes - downvotes) that an annotation receives on Genius.com based on attributes such as number of followers, length of the referent and number of contributors. Each annotation is linked to a referent or a specific chunk of text in the song so it provides really detailed analysis. Additionally, we wanted to find the best classification task that would help us classify the annotation as good or bad (depending on total number of votes).
As users, it would be helpful to know the number of votes I would get on this post to see whether I am actually improving it or not. If this machine learning project is applied, we can build a simple application in the future where users type in their annotation and they get a response saying “Yes, good post - it will increase votes by x” or “No - give it another shot”. It will help improve users annotation skills or improve overall usability of this website.
DATASET
Using the Genius API, we got the top 30 songs of the US top 10 rap artists (from Billboard/Apple charts) where each song has a different number of referents, giving us a total N = 2752 referents. We have 19 different attributes per referent, some of which include number of comments, number of contributors, and length of referent. Our target variable is stored as total votes (upvotes - downvotes). Once we got a dataset, we split it 70/30 (a standard convention) and are storing this testing data for later use. Among the remaining development data, we used 10 fold cross validation on our training data to build our model.
Part 1: Regression
Methods
Our goal was to find the best regression model for our features. Best is defined using the Pearson correlation coefficients near -1 and 1 and mean square errors closer to 0, which are indicators of better fit for our different models. We first ran a multiple linear regression with all our features then used different feature selection methods such as M5, greedy selection, and even statistical analysis to narrow down our search and reran the models with our smaller feature set. Features that proved to be statistically significant included number of verified contributors, length of referent, and page views. We also converted the number of votes to their log values in order to make our skewed distribution more uniform and tested to see if this increased the correlation. Finally, we ran a variety of K - nearest neighbor regression and found that 3-NN worked the best which we used to compare against the other linear regression models.
Results
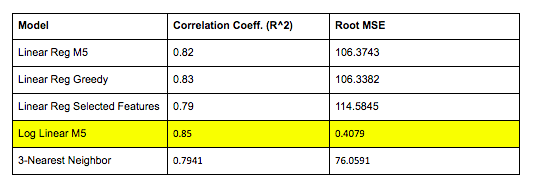
The linear regression model with M5 fit the features almost as well as greedy selection but was far more more time and computationally efficient. Another important takeaway is that converting to log improved our correlation coefficients by 3-4% so we would recommend using the converted model. Finally, we found that the selected features on their own give us a model with just a slightly smaller coefficient even when we halved the number of features so if our goal was to find the most simplified model, that would work well!
Part 2: Classification
Methods
Our quality here is measured by fitting the best classification model by predicting our target on our test set as "Good" or "Bad" based on our features. Measures such accuracy near 100% and mean square errors closer to 0 are indicators of better classification models. We tested a variety of models such as a pruned decision tree, random forests, and logistic regression. Additionally, we wanted to perform feature selection using the significant features of the decision tree and rerun the decision tree model using the selected features.
Results
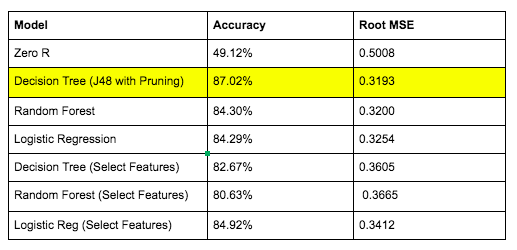
The decision tree algorithm had an accuracy of 87% which was higher than all other models. This might indicate that our pruning did prevent a good level of overfitting as it did better than random forests and logistic regression, which generally perform better as they reduce overfitting more. Another interesting observation is that the important features of the decision tree were extremely similar to those found in the feature selection process used for regression. When we reran the simplified model, we got an accuracy of 83% which is almost as good so if we wanted a simplified model, we could potentially just focus on that!
CONCLUSION
In conclusion, for our regression tasks, we would use Linear Regression with the M5 selection method with the logged target output as this gives us the highest correlation coefficient and a low mean squared error. For classification, we would want to use the Decision Tree J48 model with pruning as this gives us the highest accuracy and lowest squared error. But in both cases, a more simplified model with almost half the features performs almost as well indicating that if our purpose was to find the most simple model, we could quite safely choose that model.
